
Should cloud computing be illegal? Probably not, but it is incredibly easy to get started, equally difficult to stop, and before you know it you could be selling your grandmother just to afford one more month of that delicious compute. Hopefully your circumstances never get that dire, but I’ve seen plenty of companies entrench themselves into the highly addictive world of automated, scalable infrastructure, but then struggle to understand the often-astronomical monthly bill.
I found myself in this situation some time ago (not selling my grandmother.. but trying to understand high bills). After some wrangling, I managed to cut a client’s cloud bill by 60%, saving approximately £500,000 over 2 years, and that was despite Microsoft increasing their prices by 11% last April.
Rather than a 12-step program, I believe cloud addiction can be treated in just 6:
- Understand your costs (use the built-in tools)
- Take ownership of the costs and perform regular reviews
- Configure budgets and billing alerts
- Automate the creation and destruction of your resources (and get good at it)
- Ensure the purpose/ownership of all resources is understood
- Purchase reservations
I blogged about these topics last year on my company website. However in this blog post (and for the purposes of Azure Spring Clean) I will be focussing on #2: take ownership / perform regular reviews, by way of introducing a PowerShell module I’ve recently published to help do just that.
You may want to review your costs more frequently than monthly, but unless you have a very static environment, I think it’s a good minimum guideline as it’s how Azure usage is billed. Per step #3, it’s important to also have budgets and billing alerts configured (and with thresholds that are close to your typical costs) so that if your usage spikes unexpectedly during the month you are made aware and can intervene if appropriate.
The AzCostTools module helps perform monthly reviews by:
- Extracting your cost data via the
Get-AzConsumptionUsagecmdlet for one or more months - Comparing those months to the previous ones (or to a previous month of your choice by configuring an offset).
- Calculating the cost difference and change percentage
- Charting the daily cost, so you have a basic view of how costs fluctuate
- Retrieves any budgets you have configured and indicates where you’ve been within/over budget
- Identifying the most expensive services, by type
Per step #1 (Understand your costs - use the built-in tools), AzCostTools is not intended as a replacement for the existing cost management tools that are in the Azure Portal. I strongly advocate their use, and there’s several default views that can give you quick and valuable insight. My personal favourite is the daily cost view, granulated by Resource Group so that I can drill into where the most expensive resources are. But if you’re responsible for more than one tenant and/or multiple subscriptions, you may find AzCostTools works well to automate the reporting of those costs (both individually and in total). Another weakness of the built-in Cost Management interface is it only seems to be able to show you the data from the last 12 months. If you wanted to compare your costs for the last few months to those same months from a year prior (which might be a reasonable thing to do if your costs fluctuate seasonally), it’s not very helpful. However the Get-AzConsumptionUsage cmdlet does return data from more than 12 months ago, and so AzCostTools can do this comparison for you.
Getting started
That’s probably enough sales talk (it’s free btw..), here’s how to use it:
The module is in GitHub, so you can have a look at the source code here:
You can install the module from the PowerShell Gallery so to get started, open a PowerShell window and execute:
Install-Module -Name AzCostTools
You’ll need to also ensure you have the Azure PowerShell modules (so that you have Get-AzConsumptionUsage and some other cmdlets that the module uses). Also, if you want to generate charts, you need to install a module called PSparklines. AzCostTools will work without it, but the charts are vaguely informative and fun.
To install these prerequisites, execute:
Install-Module -Name Az
Install-Module -Name PSparklines
Finally, you of course need to make sure you’ve authenticated to Azure via the Az module, and for the tenant/s that you want to query costs. To login to Azure execute:
Connect-AzAccount
Subscription costs
You are now ready to start querying your costs. So brace yourselves, this might hurt.
A good place to start is by executing Get-SubscriptionCost, which like all great cmdlets can be executed without any supplied parameters. This will retrieve the current month’s cost data for each subscription in your current context. Because you’ll probably want to dig into the data, I recommend returning it to a variable, which in the below example is $Cost.
Note, errors may be returned for any subscriptions where the cost data is inaccessible, e.g you are not authorised to access costs, or the subscription is of a type where costs are managed externally (such as a CSP).
$Cost = Get-SubscriptionCost
Depending on the number of subscriptions and/or previous months of data you wish to query the
Get-SubscriptionCostcmdlet can take a few minutes to run. If you want to see the numbers roll in while also saving the result to a variable, you could instead doGet-SubscriptionCost -OutVariable Cost.
The cmdlet returns the most pertinent fields by default and as table output, but there’s a lot more properties returned, which you can view via $Cost | Format-List.
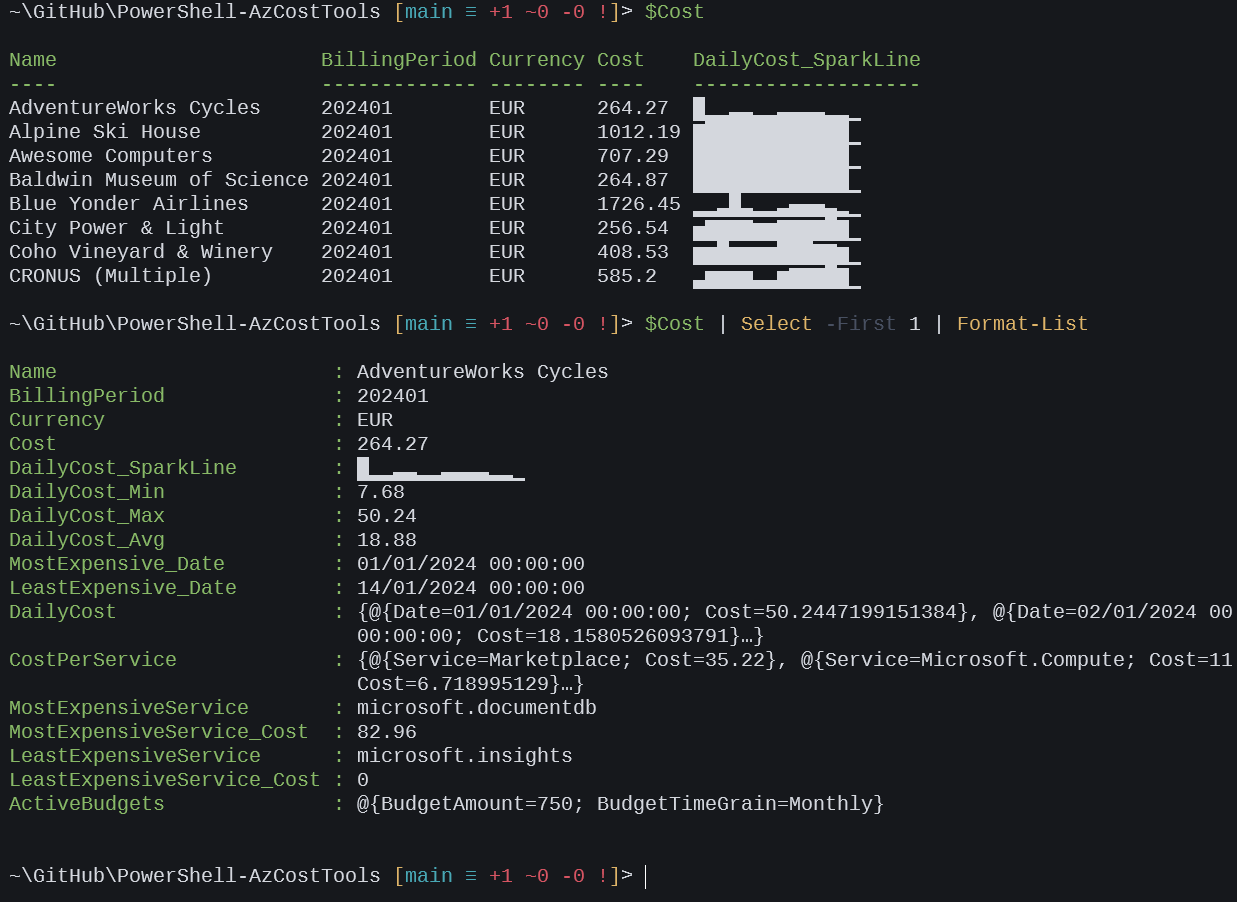
The Cost property is the total cost for the specified billing period (in this case, the current month). If you want to view the costs for a different month, you can specify that by using the -BillingMonth parameter:
$Cost = Get-SubscriptionCost -BillingMonth 12/2023
The Currency property lets you know the currency you’re being billed in. If you’ve installed the PSparklines module, you get a sparkline chart showing how the costs fluctuate per day (fun, right?). The actual daily cost values are available in the DailyCost property. Then there’s a breakdown of your cost by service type, available under CostPerService, and if you have any budgets configured (and active) these are detailed in the ActiveBudgets property. The other properties perform some useful calculations on your costs, including the average daily cost, max and minimum daily cost, the dates that were most and least expensive and finally the service types that were most and least expensive (and how much they cost).
By default the cmdlet discards the raw data that’s returned from the Get-AzConsumptionUsage cmdlet, but if you want to keep it (for your own analysis), you can add the -Raw parameter. The raw data will then be available under a property named Consumption_Raw.
You can of course specify one or more subscriptions to query, just use the -SubscriptionName parameter, with an array of one or more subscription names. You can also customise how large the sparkline graphs are (they work up to a height of 10 lines) via the -SparkLineSize parameter.
Now this is all well and good, but for me cost management is only really worth doing if there’s an element of competition, and so I like to know if I’m doing better than I did last month. It keeps me focussed through the month on minimising costs (such as by keeping test environments deployed for as little time as possible). Obviously not every month is going to be cheaper (unless you’re going out of business I guess..) but you probably know the patterns of your own business (or hopefully you will do), and when there’s likely to be higher or lower demand (such as if you’re ramping up testing at the end of a development cycle, or ramping up infrastructure for peak seasonal demand such as Black Friday / Christmas). So you can come to expect when you should be driving costs down and when they’re likely to increase.
To enable this “competitive mode”, you can execute Get-SubscriptionCost with the -ComparePrevious parameter. You can combine this with -BillingMonth obviously to specify the month you want to look at costs for, but it will also then get the previous months costs for comparison (and do some of that comparison for you). For example (note in the below I’ve also made the sparkline graphs bigger):
Get-SubscriptionCost -SubscriptionName 'AdventureWorks Cycles' -ComparePrevious -SparkLineSize 3
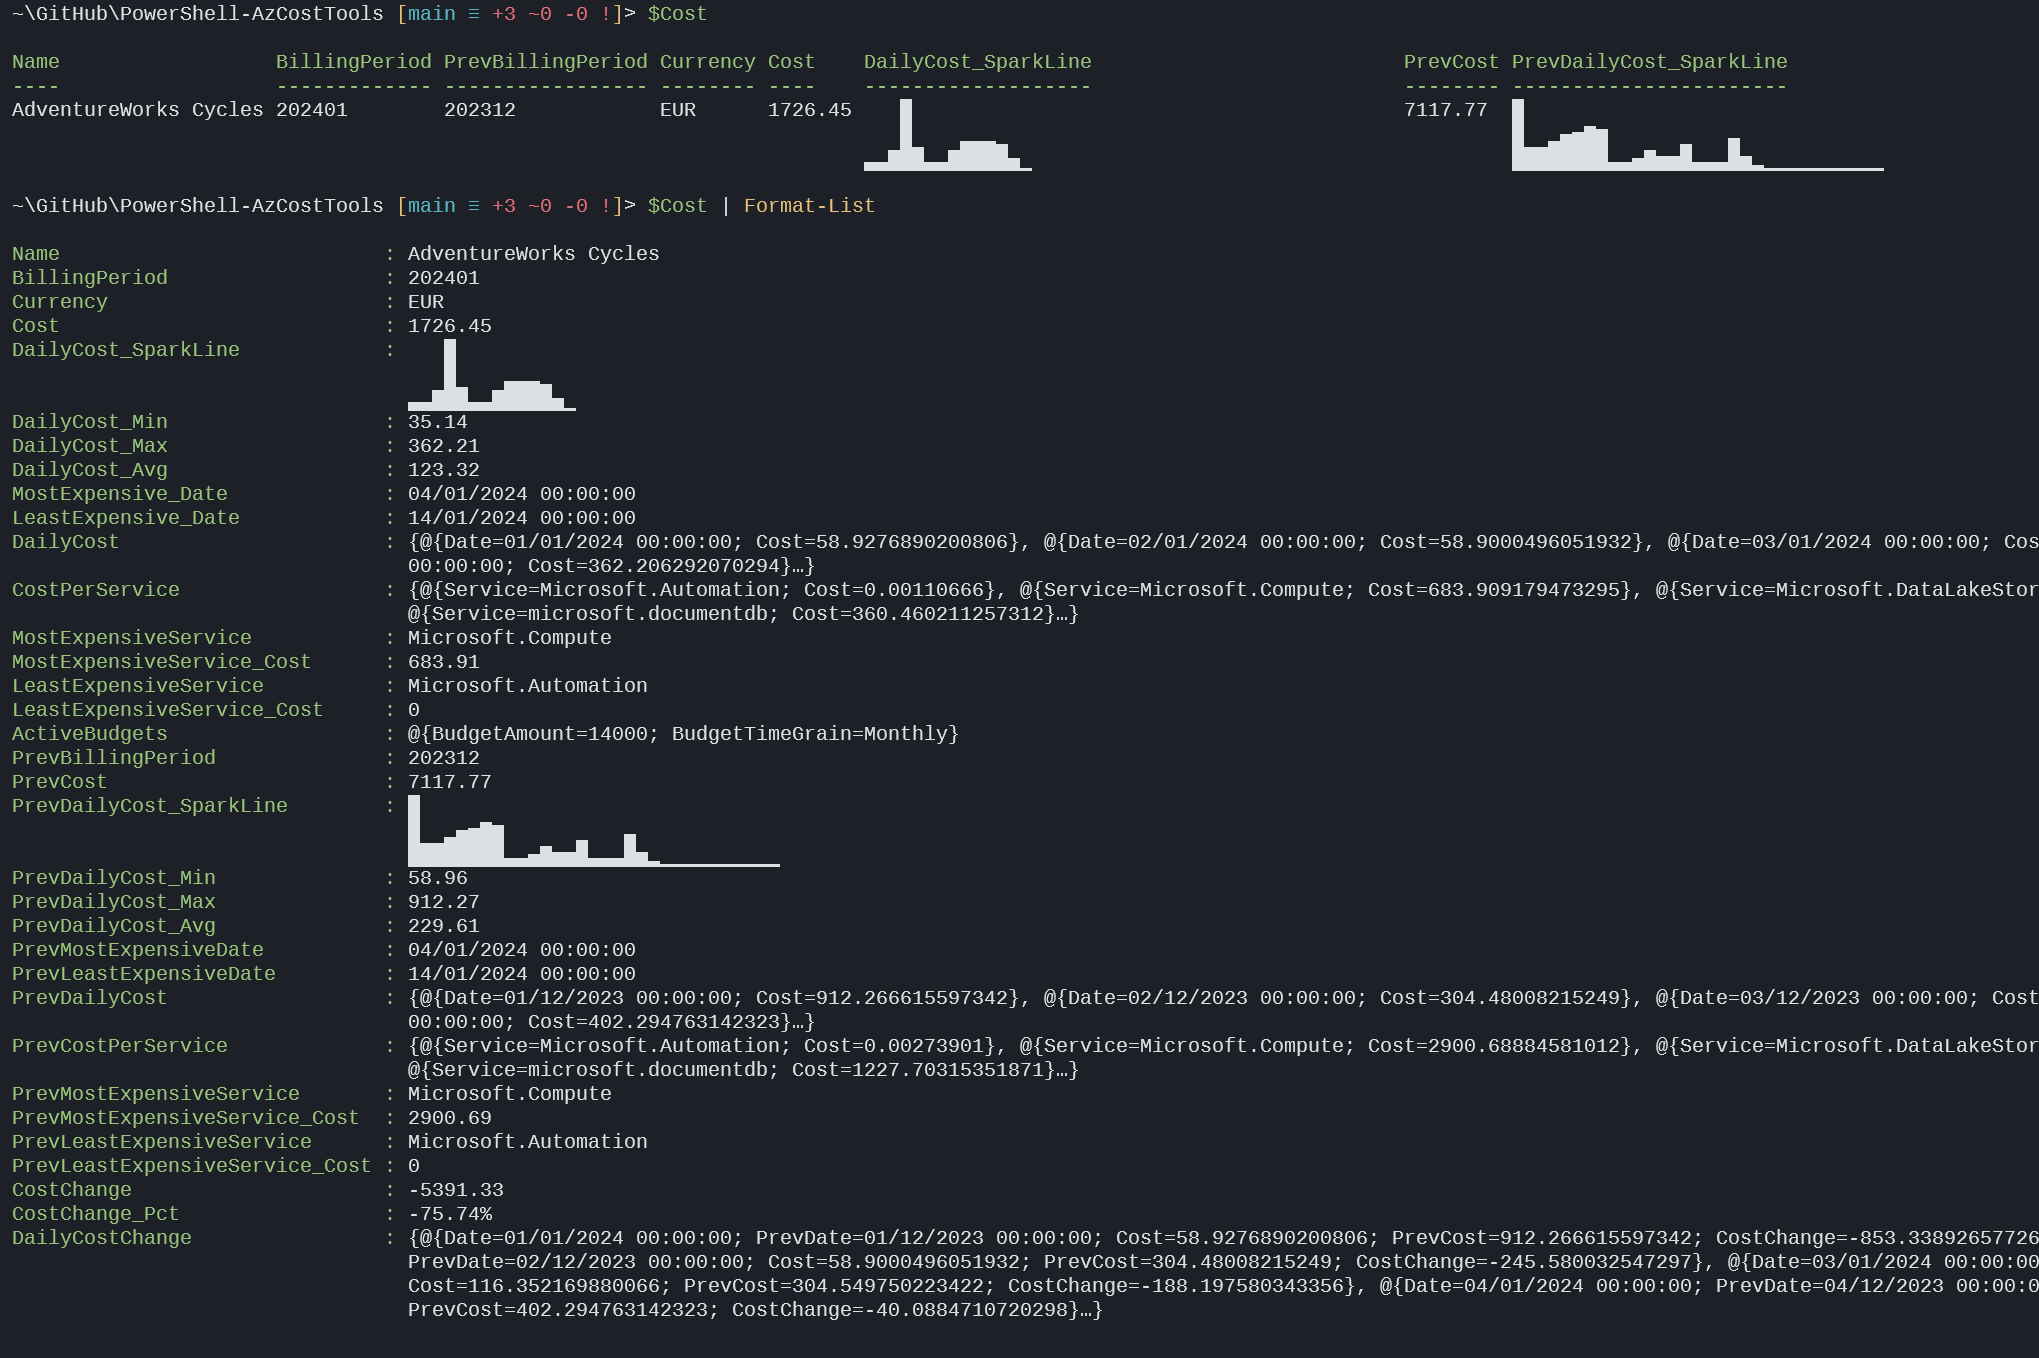
Per the screenshot above, there is again a table view returned by default, with cost, the previous month’s cost and sparkline daily cost graphs for both. If you once again do $Cost | Format-List you’ll see there’s more properties available. These include all of the same properties that were returned without using -ComparePrev, and then properties that represent the same data for the previous month (all prefixed with Prev), but where you get additional value by using this parameter is that you also get a CostChange property, which is the calculated difference between the previous month and current one, that change represented as a percentage, and then the cost change also broken down per day under a property named DailyCostChange. When I’m reporting costs I typically show the current cost for the month I’m reporting on, how much more or less that is than last month and that change as a percentage, which I think gives a very quick and easy to understand view of whether your costs are going up or down and by how much. Once again if you want the raw data for both months, using -Raw ensures these are included.
If you want to look at costs for more than a single month, you could of course make several repeated calls to Get-SubscriptionCost with different billing periods, but it has a parameter that is more convenient. If you use -PreviousMonths it will return cost data for however many previous months you specify. There’s a slight performance advantage to doing this if you’re also using -ComparePrevious because the tool will know it already retrieved the previous months cost and will just reuse it. For example:
Get-SubscriptionCost -PreviousMonths 5 -ComparePrevious
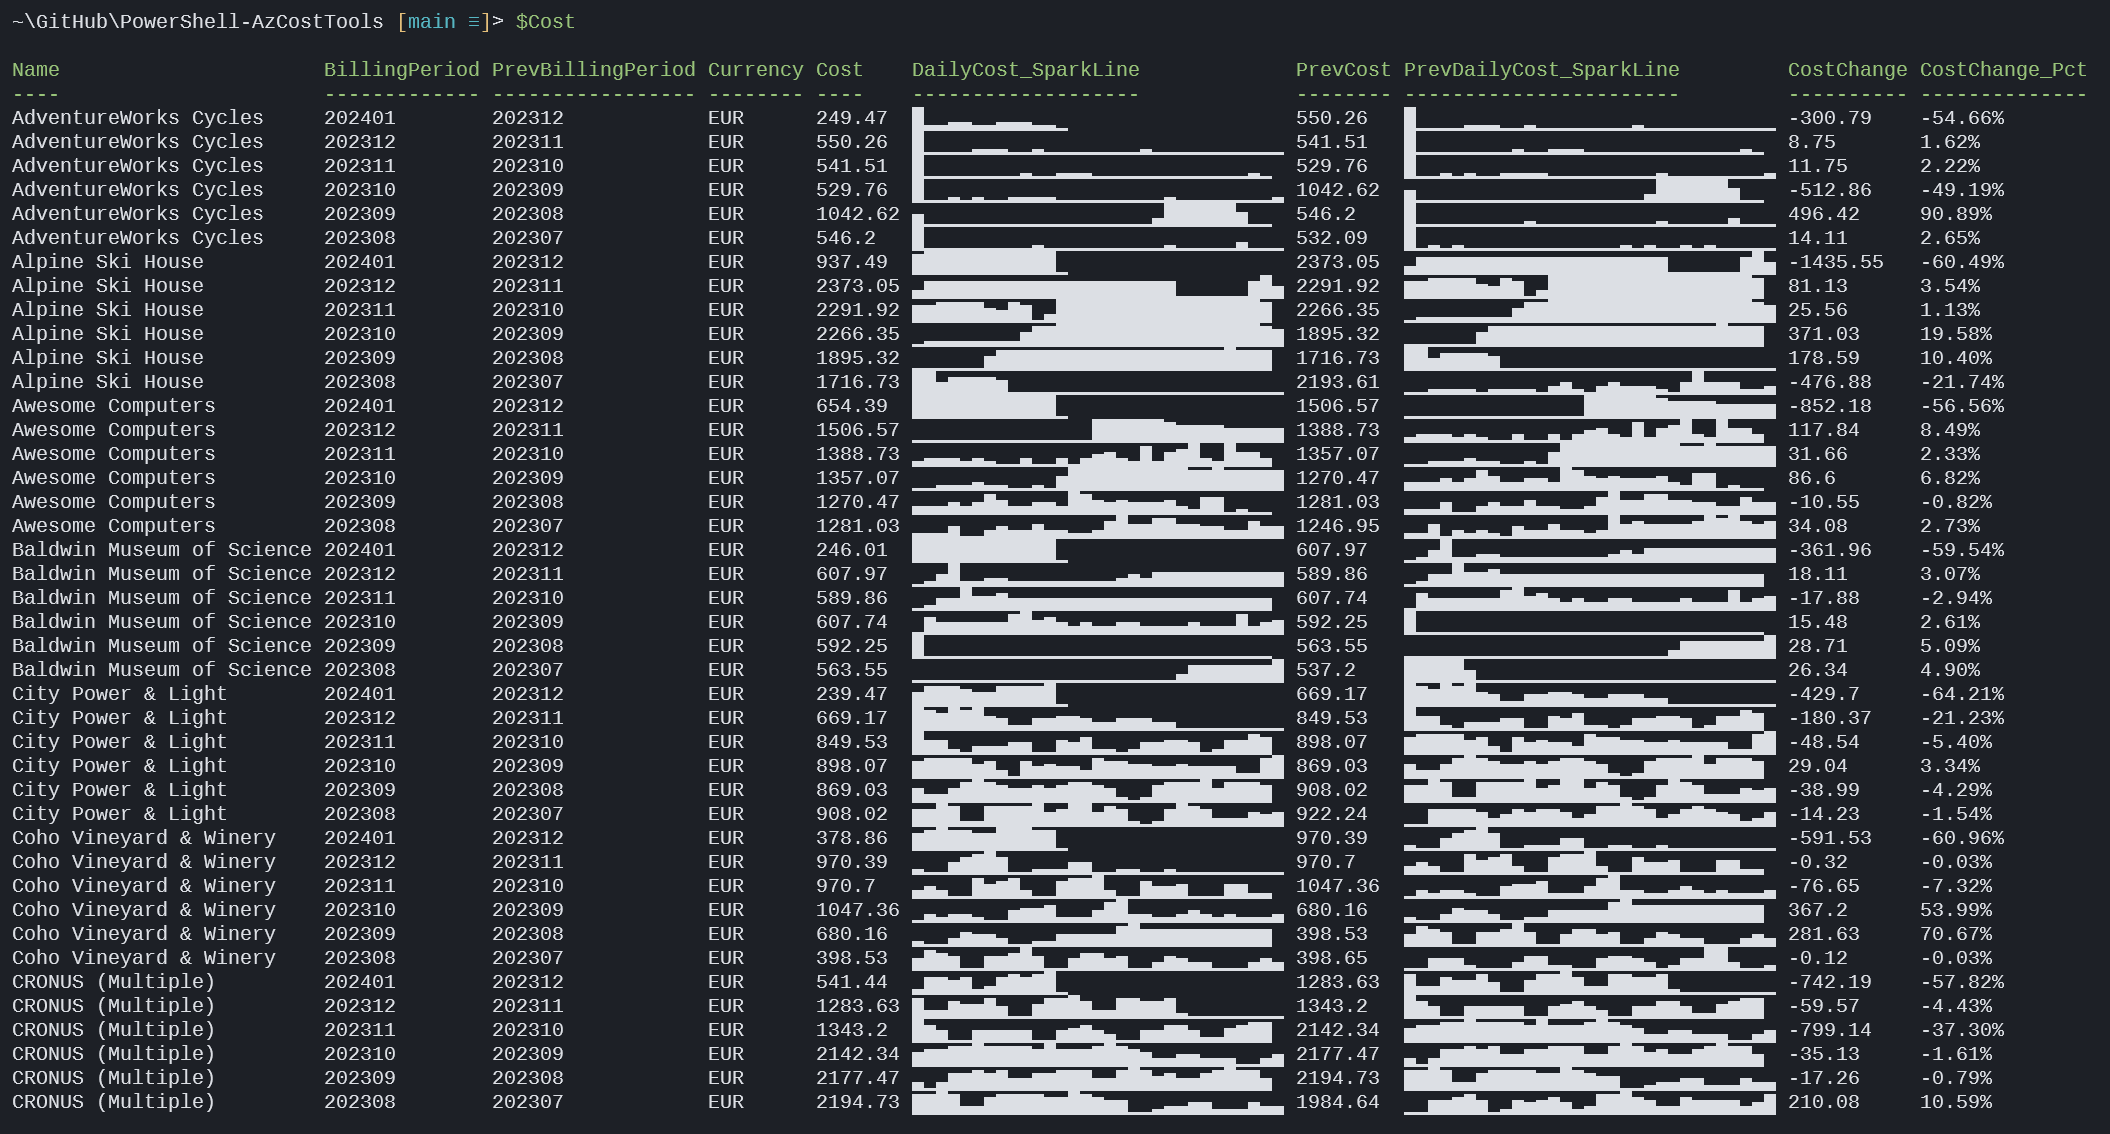
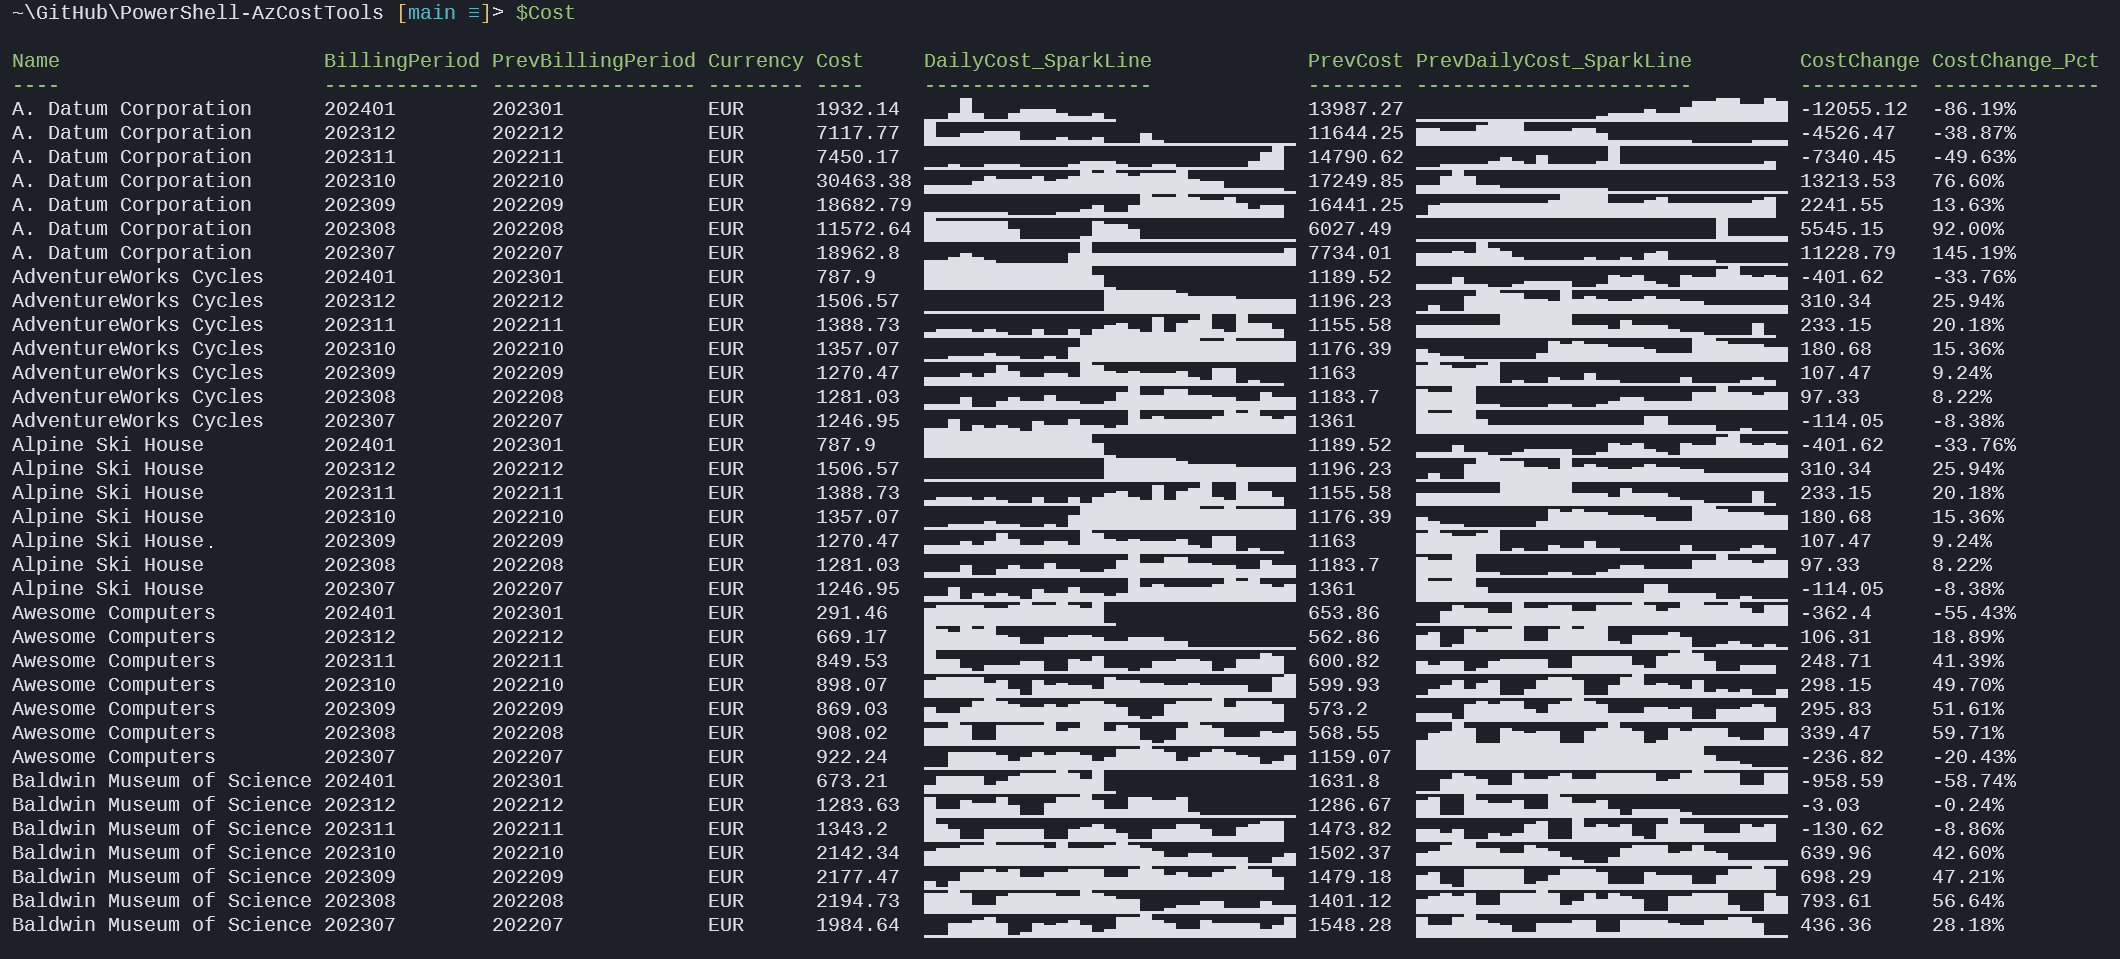
The default behaviour of comparing your costs to the previous month might not be the right choice for you. If you work somewhere with specific patterns of work (as talked about earlier, development cycles of a fixed cadence or infrastructure that is ramped up seasonally) it might be more insightful to compare to the same month from the previous period (be that last quarter, or last year etc.). To modify which month is used for comparison when using -ComparePrevious you can specify -ComparePreviousOffset. This will compare each month of cost data returned to X month/s prior as specified. You can continue to combine this with the other parameters (for example the -PreviousMonths one) so for example, if you wanted to compare costs for the last 6 months against the same 6 months from the year prior, you could execute:
Get-SubscriptionCost -PreviousMonths 6 -ComparePrevious -ComparePreviousOffset 12
Cost analysis
I expect most people (assuming anyone has made it this far) will want to take the output of this tool and do something further with it. Perhaps bring it into Excel and generate some charts (I certainly do). But I wanted to see what other useful ways I could implement PSparklines, and while we have all this data in a console window it’s potentially very quick and easy to generate some further insight there too. So without any further rambling, let me introduce Show-CostAnalysis.
Having retrieved a set of cost data for one or more subscriptions, you can pipe that data to Show-CostAnalysis to generate some charts and tables analysing the costs:
$Cost | Show-CostAnalysis
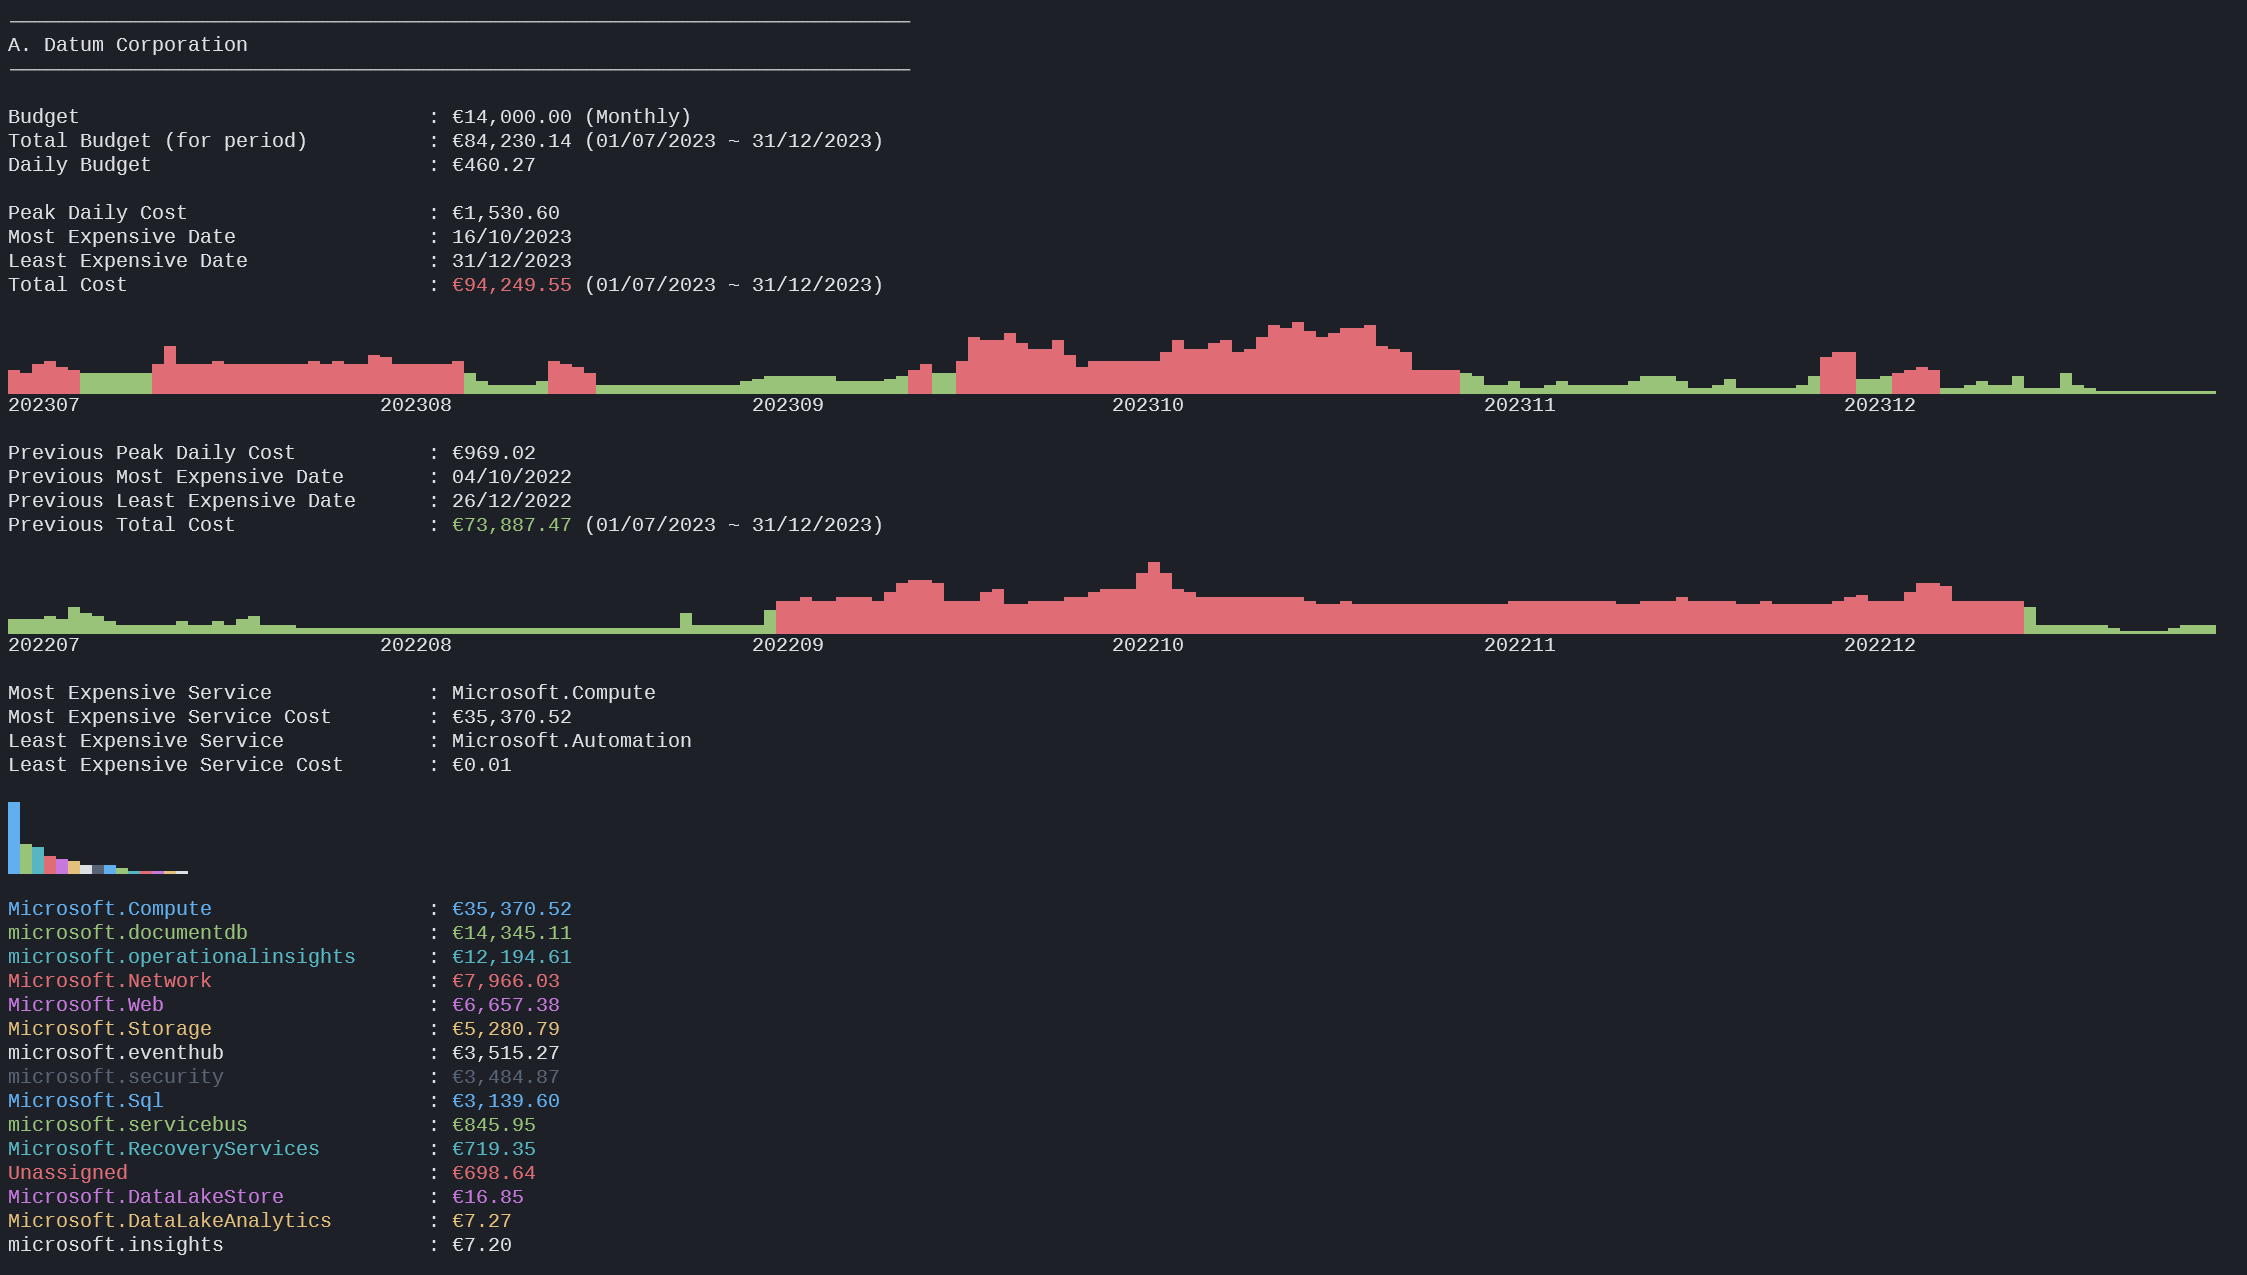
This is best experienced with PSparklines installed of course, but again it works without it. It generates a daily cost chart with a slightly more useful default height, but if your cost data returned one or more budgets, we convert one of those into a daily average and then use that to colour the daily cost chart to show where you were over budget (in red) and under budget (in green). If your subscription doesn’t have a budget, the chart is white. It also shows a little summary for each Subscription detailing the budget used, the daily budget calculation it generated, your peak daily cost, the most/least expensive date and total cost. If there’s a budget configured, the cost is in green if you’re within that overall budget and red if it’s over.
The tool then breaks down the costs by service type, creating a chart with different colours for each type, and again summarising the most/least expensive services and their cost. It will do this for up to 15 service types (after which we sort of ran out of console colours).
If more than one subscription is in the cost data, the cmdlet will end with a total of cost for all subscriptions and another chart showing most to least expensive. This is a little slow to produce (its largely down to the sparkline charts which take a few seconds each to generate):
There’s a couple of parameters on Show-CostAnalysis: you can again customise the size of the charts returned by specifying -SparkLineSize. The default is 3. But perhaps more usefully, you can also specify -ConvertToCurrency with a 3-letter currency code if you’d like the cost values returned to be converted to a different currency. Sometimes Azure costs are billed in a currency that is not your own and it may be more informative to view them in your local currency. For example:
$Cost | Show-CostAnalysis -ConvertToCurrency GBP
Note that this uses a free/open API for currency conversion that only refreshes the exchange rates once a day. I thought this functionality was so useful I spun it off into its own module which you can read about here:
AzCostTools doesn’t need this separate module installed, it has the functionality built in.
If you used -ComparePrevious when executing Get-SubscriptionCost you can also specify -ComparePrevious for Show-CostAnalysis to generate further tables and charts for the previous cost data. This might be most useful when using -ComparePreviousOffset so that you can see the charts side by side of the current and previous costs. For example:
$Cost | Show-CostAnalysis -ComparePrevious
Bear in mind the output of Show-CostAnalysis is not objects, so there’s nothing here you can easily export or pipe into another cmdlet, but most of the calculations it uses were already performed via the Get-SubscriptionCost cmdlet, so the data is there.
Storage costs
I plan to continue to expand AzCostTools with other useful cost-related functionality, hence the slightly generic name. One such expansion is to start to dig into the cost of Storage. Returning to my original tongue-in-cheek premise, I think it’s not outrageous to think of cloud storage as like the gateway drug of cloud computing, because it is incredibly cheap. But sometimes cloud costs can be death by a thousand cuts, and over time you can end up with hundreds of small storage accounts littered through your subscriptions that individually aren’t expensive, but still represent a waste that cumulatively can become significant.
To help you understand your storage costs specifically, you can execute:
Get-StorageCost
It works in a very similar to way to Get-SubscriptionCost (mostly because I started by just copy/pasting that function). By default it will query all available storage accounts in your current context, or you can specify one or more storage accounts via the -AccountName parameter. And then it has the other parameters you’ll find familiar: -BillingMonth, -ComparePrevious, -ComparePreviousOffset, -PreviousMonths and -SparkLineSize. It’s particularly useful for seeing which storage accounts are the most expensive, and which storage accounts are experiencing active change vs being static.
In summary
In summary, Drugs = bad. Cloud = good. Reducing cloud costs = great. If I were dispensing any specific advice, I would say don’t be afraid to take responsibility for managing your costs, particularly if no one else does. If not for any other reason, saving companies money looks great on your CV. Of course work within the bounds of your organisation, and with suitable permission to make changes.
A final caveat, this AzCostTools module was slightly cobbled together, so please let me know if you experience any bugs, and please don’t sue me if you get any erroneous results. But more than anything, please let me know if you have any ideas for improvements. You can log those here:
Thanks for taking the time to read this blog post, I hope you found it useful. Enjoy more great content from Azure Spring Clean 2024 via the website here:
or by following #AzureSpringClean on LinkedIn or the website formerly known as Twitter.


Comments