
This blog post describes how you can use the open source tools Influx and Grafana along with a PowerShell module I’ve authored on Windows to create and populate interactive metric and monitoring dashboards like this one:
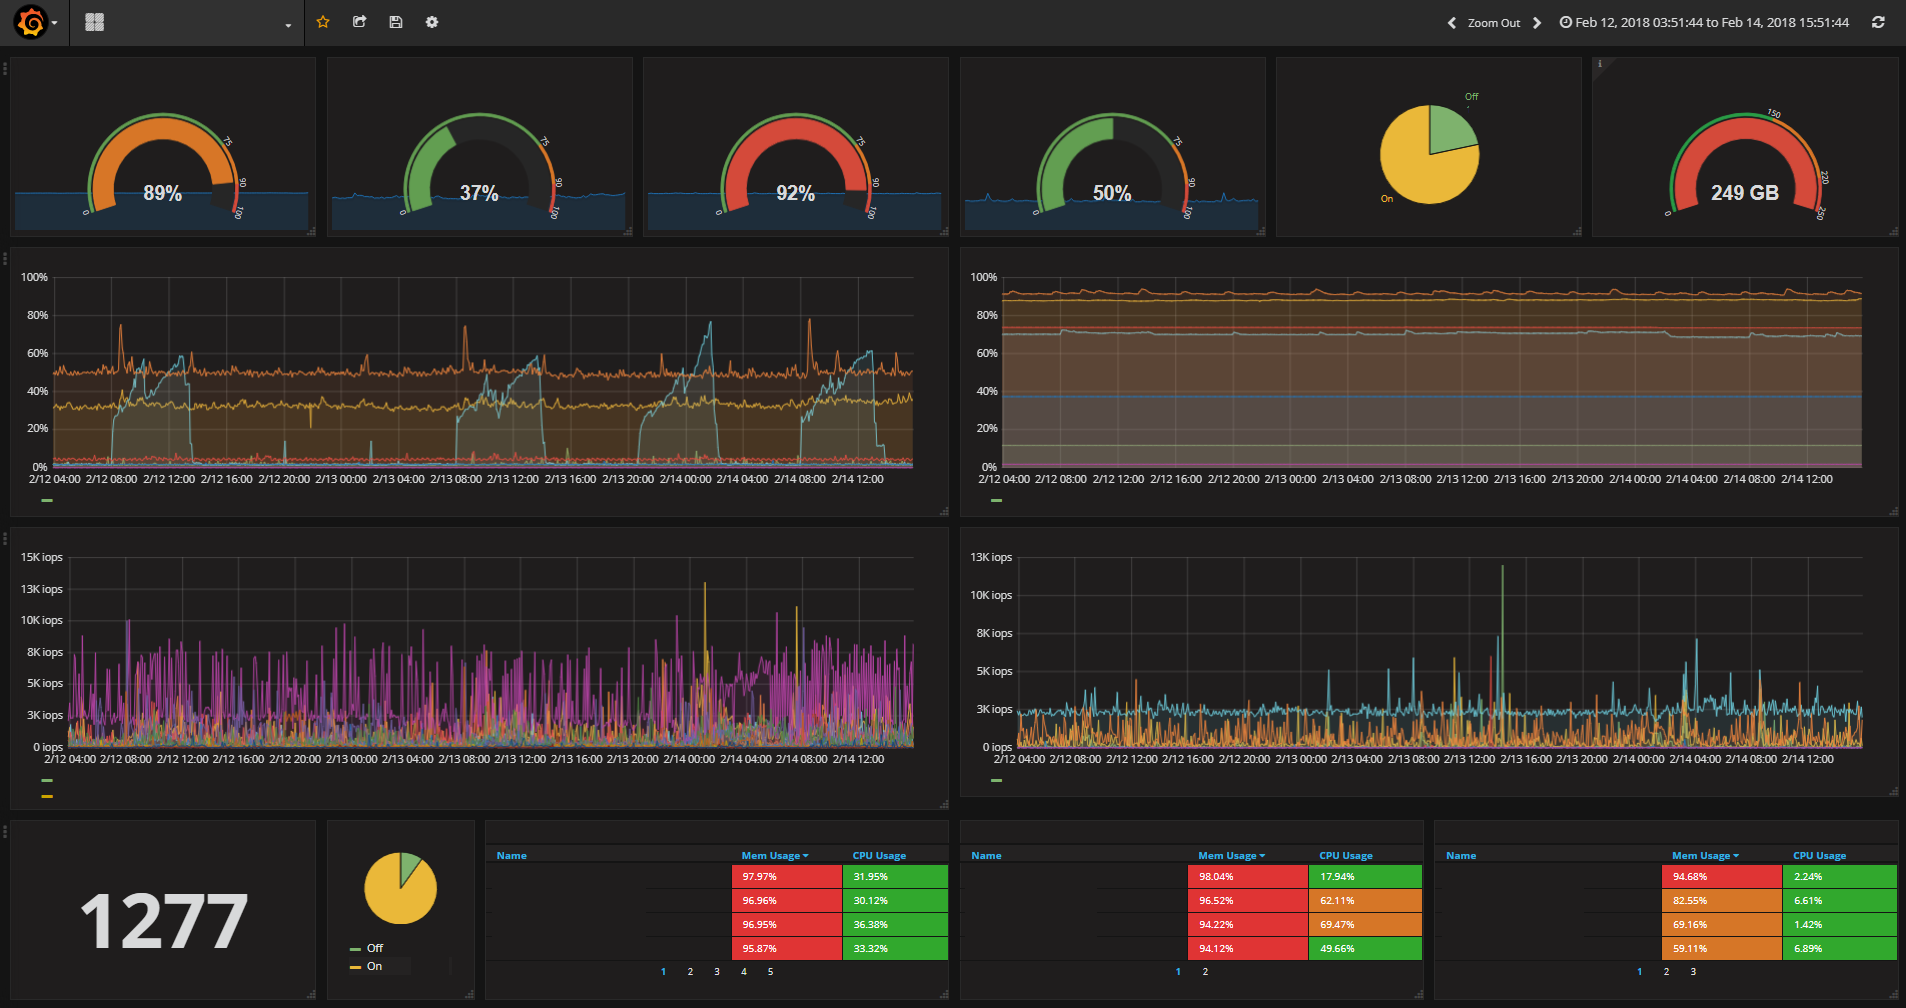
(– note that all the graph labels and legends from the above screenshot have been removed to anonymize the data.)
I recently attended a DevOps meet up hosted by Shazam in their London office. The talks were held in a breakout area next to their open plan office space, through which were pillars covered in monitors displaying various Grafana dashboards. I hadn’t seen Grafana before and this piqued my interest.
In case you’re not aware, Grafana is an open source metrics dashboard and graph editor. It’s power and popularity lies in the fact that it lets you put together beautiful looking dashboards with incredible ease that give you instant insight in to any metrics you wish to track (as well as allowing you to aggregate metrics from multiple sources).
Whether you are in development or operations or somewhere in between, you often want or need the ability to quickly and easily monitor something closely, be that a server, network or infrastructure metric or some component or behaviour of your application. Monitoring and measuring is a core tenet of DevOps.
“If it moves, we track it. Sometimes we’ll draw a graph of something that isn’t moving yet, just in case it decides to make a run for it.”
Grafana is purely a front-end visualisation tool, so to use it you need one or more back-end time series database systems to operate as a data source. There’s lots of options to choose from and the list is growing all the time as developers can add new data source providers as plug ins.
I looked for something that I could install on Windows and ultimately decided to try out InfluxDB.
InfluxDB
Influx is an open source time series database product. It is actually four components which make up what they call the TICK stack:
- Telegraf – Time-Series Data Collector
- InfluxDB – Time-Series Data Storage
- Chronograf – Time-Series Data Visualization
- Kapacitor. – Time-Series Data Processing
To back-end Grafana you only actually need InfluxDB, but all the components are pretty simple to install on Windows as follows:
Prerequisites
- Deploy/locate a Windows server to act as host. I used a Windows 2012 R2 Server.
- Download the four Influx components from https://portal.influxdata.com/downloads to somewhere on your host machine, e.g C:\Influx<component>
- Download NSSM (tool for installing an application as a Windows service) and place NSSM.exe in C:\Windows\System32 (or some other PATH directory if you wish).
Installing InfluxDB
- Open an Administrator PowerShell Window and go to your InfluxDB directory (e.g C:\Influx\InfluxDB).
- Run
influxd.exeto check it starts successfully (note that Influx.exe is the CLI tool). If it does, stop it and then install it as a service as follows:nssm install InfluxDB "C:\Influx\InfluxDB\influxd.exe"
- Run
By default, InfluxDB uses the following network ports:
- TCP port 8086 is used for client-server communication over InfluxDB’s HTTP API
- TCP port 8088 is used for the RPC service for backup and restore
You can check that InfluxDB is working correctly by opening a PowerShell/cmd window, changing to the directory you installed it (e.g C:\Influx\InfluxDB\ if you followed the above) and running .\influx.exe which is the CLI tool. Here are some useful commands:
help– list commandsshow databases– list the current databasescreate database <name>– create a new database called<name>(if there isn’t a default DB you want to use, create one now).
Installing Telegraf (optional)
Telegraf is the InfluxData plugin-driven server agent for collecting and reporting metrics.
Per the above, you can use Telegraf as an agent for collecting metrics from a server. Later in this blog post I am going to introduce how you can collect/query your metrics directly with PowerShell but if you want a generic server agent for monitoring Telegraf is worth installing.
To install Telegraf:
- Go to your Telegraf download directory and open
telegraf.conf. Change thelogfilepath to/telegraf.log.- Open an Administrator PowerShell Window. Run Telegraf.exe, if it starts up successfully then stop it and install it as a service as follows:
C:\Influx\Telegraf\telegraf.exe --service install --config C:\Influx\Telegraf\telegraf.conf
- Open an Administrator PowerShell Window. Run Telegraf.exe, if it starts up successfully then stop it and install it as a service as follows:
Installing Chronograf (optional)
Chronograf is InfluxData’s open source web application. Use Chronograf with the other components of the TICK stack to visualize your monitoring data and easily create alerting and automation rules.
As noted earlier, Chronograf provides the same functionality as Grafana. I haven’t explored it in detail yet so can’t comment on whether it’s worth using. However you can install it alongside Grafana (they use different ports by default) and it’s simple to install as follows:
- Open an Administrator PowerShell Window and go to your Chronograf directory.
- Run
chronograf.exeto check it starts successfully. If it does, install it as a service as follows:nssm install Chronograf "C:\Influx\Chronograf\chronograf.exe"
- Run
If Chronograf is working, you should be able to access it via http://localhost:8888/ (although again note that it isn’t core to this blog post, you just might find it interesting to explore).
Installing Kapacitor (optional)
Kapacitor is the InfluxData processing framework for creating alerts, running ETL jobs, and detecting anomalies in your data. Kapacitor is responsible for creating and sending alerts in Chronograf.
If you want to install Kapacitor, you can do so as follows:
- Open an Administrator PowerShell Window and go to your Kapacitor directory.
- Run
kapacitord.exeto check it starts successfully. If it does, install it as a service as follows:nssm install Kapacitor "C:\Influx\Kapacitor\kapacitord.exe"
- Run
Start the services
You can now start all the services you created above. Beware that if you run the services as the local system identity, Influx will store its data by default in:
C:\Windows\System32\config\systemprofile.influxdb\data
If you run it as a named user, it will store its data in:
c:\Users\<username>\.influxdb\data\
You can specify the data directory by changing .\influxdb.conf in the Influx DB directory, but note that you will then also need to use nssm to modify the service so that it starts influxd.exe with -config infludb.conf to have it use your config file.
Grafana
You can download Grafana from here.
Installing Grafana
Grafana provides documentation on installing it on Windows which I recommend you check in case the below is out of date. That being said, it should be as simple as:
- Extract the downloaded Grafana files somewhere on your system. E.g C:\Grafana.
- Go in to the
\Confdirectory and copysample.initocustom.ini(you should editcustom.iniand neverdefaults.ini). - The default Grafana port is 3000 but this requires extra permissions on Windows, so uncomment the
http_portconfig section and change it to another port (e.g 80 or 8080). - Open an Administrator PowerShell window. Check grafana-server.exe runs OK manually, then stop it and use NSSM to install it as a service as follows:
nssm install Grafana "C:\Grafana\bin\grafana-server.exe"Then start the service.
- Go in to the
If Grafana is working, you should now be able to access it via http://localhost:80/ (or whatever port you chose). For more guidance on getting started with Grafana see here.
Writing metrics to Influx
There is detailed information on how to write to Influx in their own user guide, but below are some examples of how you might transmit metrics to a database in Influx named ‘yourdb’.
When writing metrics to Influx you provide the name of a metric, some optional key/value pair tags and then a value for the metric. You can also optionally include a timestamp (omitted it just uses the time of write). You can provide multiple metrics in a single submission, you just need each to be on a separate line.
Writing a metric via CURL:
curl -i -XPOST 'http://localhost:8086/write?db=yourdb' --data-binary 'cpu_load_short,host=server01,region=us-west value=0.64 1434055562000000000'
In the above example cpu_load_short is the name of the metric, it has two tags host and region with their values, and the metrics own value is 0.64. The 1434055562000000000 part is the (optional) timestamp.
Note that you don’t have to create any existing tables or fields in your Influx database in advance when writing a metric. When you submit a new metric for the first time Influx creates it on the fly.
Writing a metric via Invoke-WebRequest:
Here is the above example again, submitted via PowerShell’s Invoke-WebRequest cmdlet:
Invoke-WebRequest 'http://localhost:8086/write?db=yourdb' -Method POST -Body 'cpu_load_short,host=server01,region=us-west value=0.64 1434055562000000000'
PowerShell-Influx
In order to simplify and standardise writing to Influx with PowerShell, i’ve written a module named PowerShell-Influx which you can find on Github and in the PowerShell Gallery. If you have PS5/PackageManagement you can install the module as follows:
Install-Module Influx -Scope CurrentUser
Write-Influx
The module provides a Write-Influx cmdlet, which essentially wraps the Invoke-WebRequest example shown above, but takes the metrics and tags you want to submit as hashtables.
Here’s an example of how you could use Write-Influx to capture the Memory and CPU stats of a server every 5 seconds:
While ($true){
    $Metrics = @{
        Memory = (Get-Counter '\Memory\Available MBytes').CounterSamples.CookedValue
        CPU = (Get-Counter '\Processor(_Total)\% Processor Time').CounterSamples.CookedValue
    }
    Write-Influx -Measure Server -Tags @{Server=$env:COMPUTERNAME} -Metrics $Metrics -Database yourdb -Server http://localhost:8086 -Verbose
    Start-Sleep -Seconds 5
}
Note that Write-Influx (as with the Invoke-WebRequest example) is submitting the metrics via a TCP request. TCP is a connection-oriented protocol. If the InfluxDB server was down, your script would wait until the connection timed out before continuing, or could even throw an exception causing the script to terminate.
While this might be fine if you’re capturing metrics via some dedicated monitoring script, it might be an issue if you were embedding metric capturing code inside an application that you need to be stable and performant. Fortunately, Influx can be configured to run a UDP listener. UDP is connectionless, so its an ideal candidate for this scenario, where the metrics can be sent to a UDP socket and the code then immediately continue, with no pause to confirm receipt.
Write-InfluxUDP
To write to the Influx UDP listener with the PowerShell Influx module, you can use Write-InfluxUDP. Here’s an example:
While ($true){
    $Metrics = @{
        Memory = (Get-Counter '\Memory\Available MBytes').CounterSamples.CookedValue
        CPU = (Get-Counter '\Processor(_Total)\% Processor Time').CounterSamples.CookedValue
    }
    Write-InfluxUDP -IP 1.2.3.4 -Port 8089 -Measure Server -Tags @{Server=$env:COMPUTERNAME} -Metrics $Metrics -Verbose
    Start-Sleep -Seconds 5
}
Note that you have to provide an IP address for the endpoint. DNS names are not supported. Otherwise the cmdlet works in the same way, taking hashtables for the metrics and tags you want to submit.
Write-StatsD
As a third option, the PowerShell Influx module also provides Write-StatsD for writing metrics in to Influx via a statsd listener.
“Statsd is a network daemon that runs on the Node.js platform and listens for statistics, like counters and timers, sent over UDP or TCP and sends aggregates to one or more pluggable backend services (e.g., Graphite).”
– https://github.com/etsy/statsd
Influx can be configured with to run a built-in StatsD listener, so there’s no need to run/install it directly. You do this via the Telegraf component, and need to go to:
C:\Influx\Telegraf\Telegraf.conf
And enable/configure the listener per the settings in the # Statsd Server section. By default StatsD listens on port 8125 and as a UDP endpoint.
StatsD has its own line protocol for submitting metrics which the cmdlet accepts directly as a string. Here’s an example:
While ($true){
    $Memory = (Get-Counter '\Memory\Available MBytes').CounterSamples.CookedValue
    $CPU = (Get-Counter '\Processor(_Total)\% Processor Time').CounterSamples.CookedValue
    Send-Statsd -IP 1.2.3.4 -Port 8125 -Data "Server.Memory,Server=$env:COMPUTERNAME`:$Memory|g" -Verbose
    Send-Statsd -IP 1.2.3.4 -Port 8125 -Data "Server.CPU,Server=$env:COMPUTERNAME`:$CPU|g" -Verbose
    Start-Sleep -Seconds 5
}
Note that you can’t specify a destination database when using the StatsD Influx listener, the metrics are just written to the default database (although I think you can set config in
telegraf.confto route different metrics to different databases depending on the metric name).
Get-*Metric cmdlets
To aid data collection, the PowerShell Influx module also contains a number of cmdlets for gathering some standard metrics from various datasources.
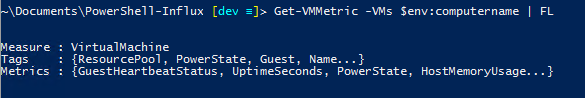
At time of writing the module has cmdlets for gathering metrics from 3Par, VMWare, Isilon and TFS. These return a custom metric PowerShell object which have the specified measure name, gathered metrics and tags (as hashtables) and (if specified) timestamp properties. You can then pipe this object in to one of the above Write- cmdlets to transmit to Influx (giving you flexibility to choose which method of transmission you want to use).
Here are some examples:
Get-DatastoreMetric | Write-Influx -Database VMWareStats
This returns metrics for any VMWare Datastores such as capacity and free/used space (you need to have the VMWare PowerCLI cmdlets installed and have connected to a server via Connect-VIServer first). It then writes these to Influx via the standard REST API method in to a database named VMWareStats.
Get-3ParSystemMetric -SANIPAddress '3.4.5.6' -SANUserName someuser -SANPasswordFile 'C:\some3parpasswordfile.txt' | Write-InfluxUDP -Database 3ParData
This retrieves 3Par System metrics such as raw free and usable free space (using the HPES3PARSToolkit module and having stored your password via Set-3parPoshSshConnectionPasswordFile first). It then writes them to Influx via the Influx UDP listener to a database named 3ParData.
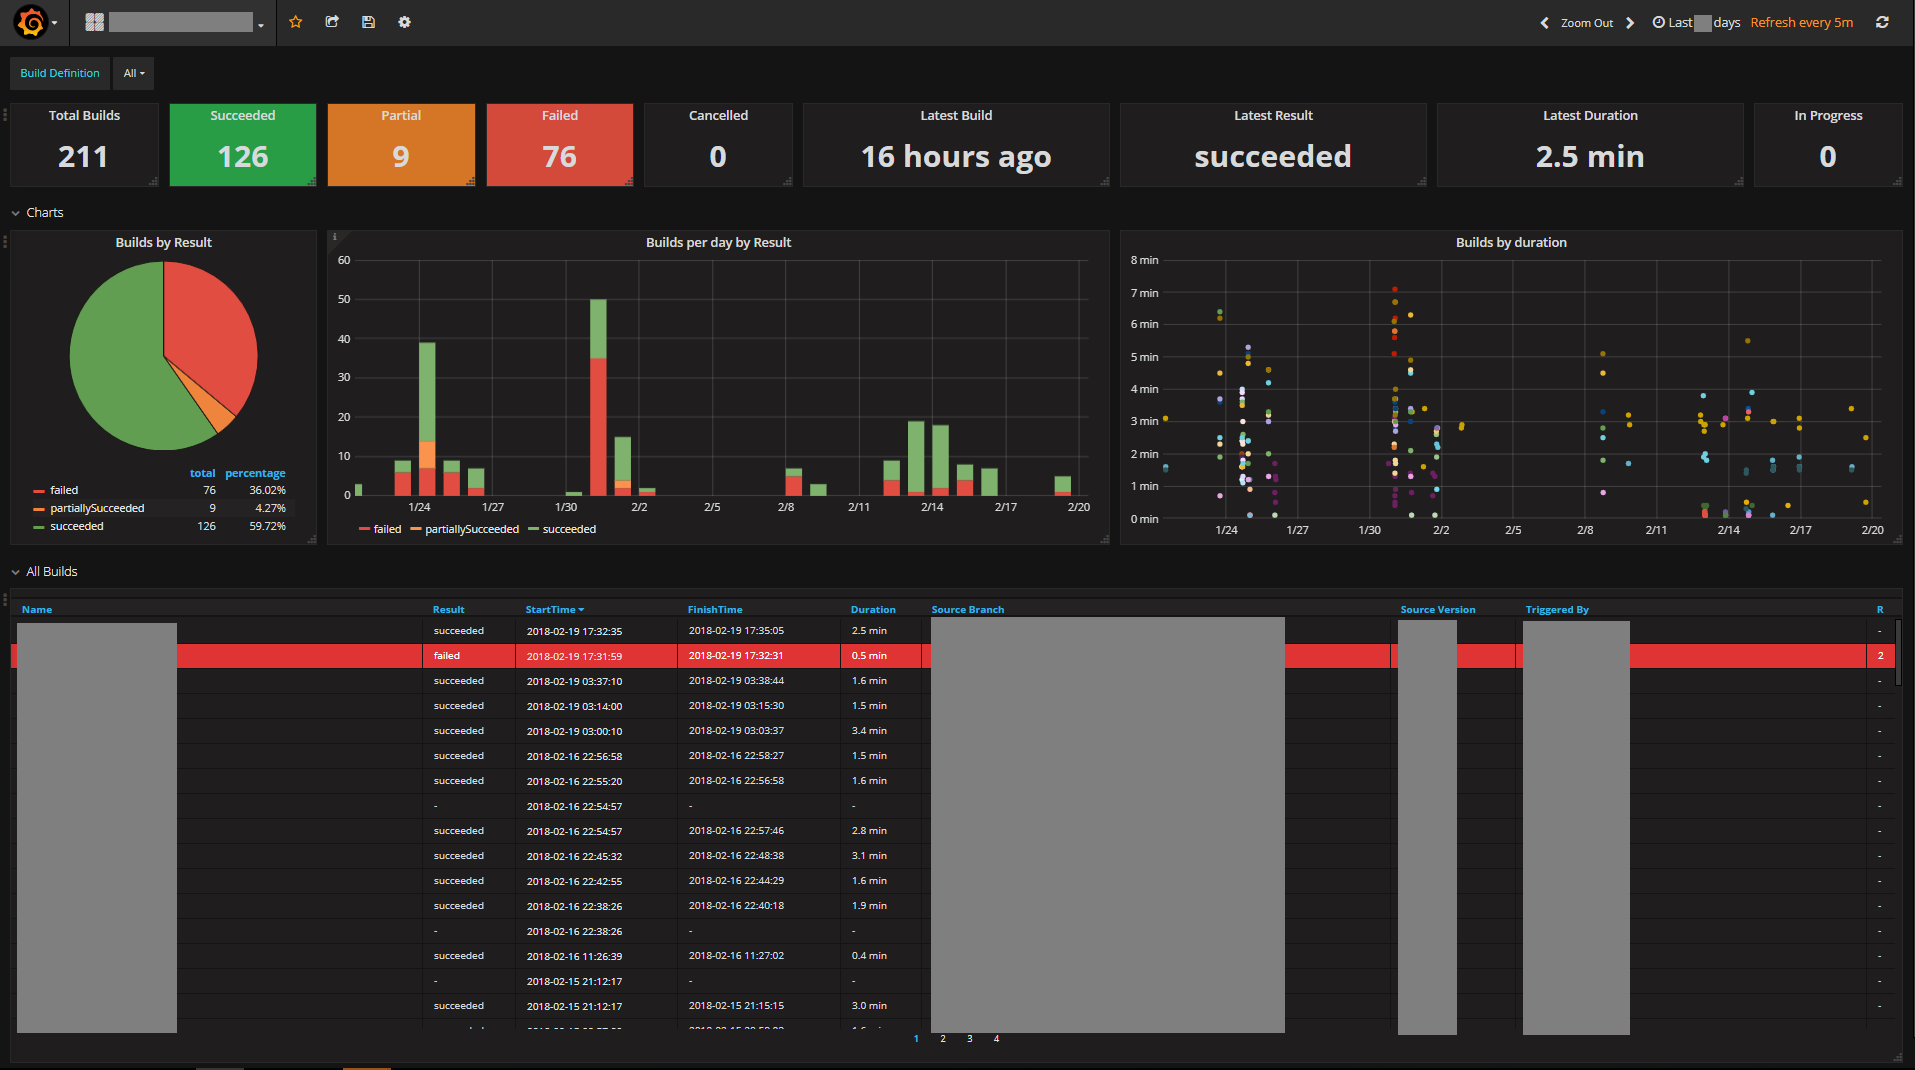
Get-TFSBuildMetric -TFSRootURL 'https://mytfsurl.local/tfs' -TFSCollection somecollection -TFSProject someproject | Write-StatsD -Type g
This returns TFS Build data such as build name, result, duration (via this TFS module) and sends these to Influx via StatsD (note that Write-StatsD converts the piped metric object to StatsD formatted strings automatically).
Here’s how I’m presenting the TFS build data in Grafana:
There are also Send- cmdlets for each of the Get- cmdlets which just perform the equivalent Get- cmdlet and then submit the metrics immediately to Influx via the standard Write-Influx method.
Visualising your metrics with Grafana
Having (hopefully) got some metrics in to Influx you probably now want to see them. As mentioned earlier, I suggest looking at the Getting started with Grafana guidance directly, but here’s a brief intro:
- Open Grafana http://localhost:80/ (or whatever port/URL you’re using)
- Go to Data Sources > Add data source
- Enter a name for your datasource.
- Change “Type” to InfluxDB. Select the default HTTP settings (e.g URL: http://localhost:8086) if your InfluxDB is running on the same server as Grafana. Leave the access as “proxy” (selecting “direct” will make Grafana attempt to read the datasource from wherever you currently are accessing it in a browser).
- Enter the name of the database you want to query.
- Click “Add”.
Now go to “Dashboards”:
- Click Dashboards > New
- Add a Graph panel. Click its title and click “edit”
- Change “Data Source” to the data source you added.
- Select the measurement you submitted (the name you provided for your measure).
- Select the field/s you want (or enter * for all).
- By default Grafana doesn’t join together points (so your graph might look blank). Go to the display tab and change “Null value” to “connected” to join together the points. Ensure “Draw mode” has “Lines” ticked also.
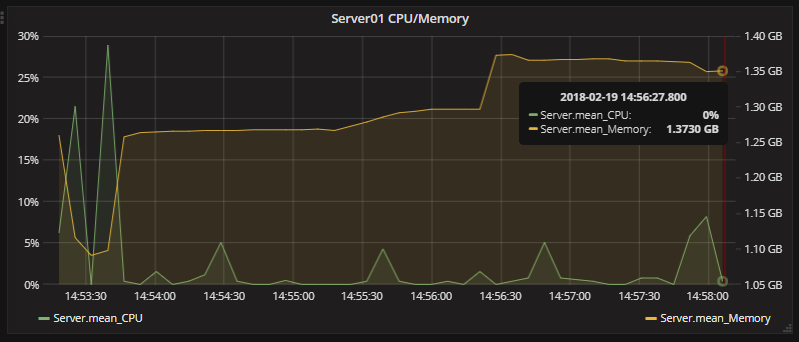
You probably want to customise other things. For example go to “Axes” and change the unit to something more appropriate. Another good tip is that you can click on the colour of a measure in the legend of the graph and move it over on to the Right Y axis if you’re displaying two metrics that have different units.
Here’s the server CPU/Memory stats gathered in the examples above visualised:
Summary
I hope this has served as a useful introduction to Influx, Grafana and my PowerShell-Influx module. I definitely suggest reading the official pages for Grafana and Influx to learn more about how to configure and customise them (for example you might want to enable outbound email for Grafana alerting and you can also Active Directory integrate the login).
If you have any ideas for improvements to my PowerShell-Influx module please feel free to fork the repo and submit a PR.


Comments